
POV: Your boss ordered a sales report that visualizes specific cuts of data in an easy-to-interpret way by the end of week. No big deal! But now it’s lunchtime on a Summer Friday, and you’re kicking yourself in the a** because…procrastination.
What if I told you that you could complete the assignment in 20 minutes without creating any visuals or writing any formulas? No genie or crossroads deal-making required. Believe it or not, it’s possible with Excel’s Analyze Data tool.
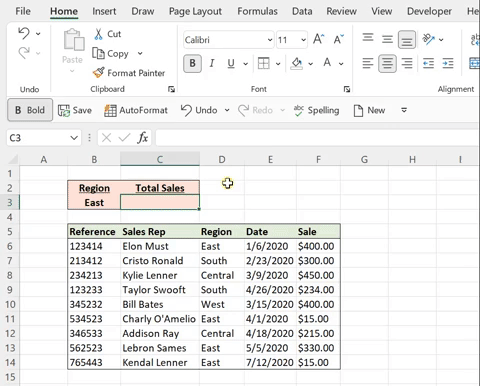
This tool analyzes your data and creates a selection of high-level visual summaries that can be inserted into any spreadsheet, leaving you more time to relax by the pool. First, select a cell within a data range and then go to Home > Analyze Data and browse through all the visual summaries that Excel can churn out! If you see one you like, simply click the +Insert button on the bottom left corner of the graphic.
Now, let’s say your boss specifically wants a summary of June sales by year, and you don’t see it created in the Analyze Data insights window. Don’t panic! Just select the text box at the top of the Analyze Data window, type in how you want to summarize your data (like it’s a Google search), and Analyze Data will return more visual summaries that are workbook ready.
Now it’s time to send off your hard work and take a very well-deserved siesta by the poolside. We won’t tell.